by Kathleen Austin & Gerald Kendall

Part 1 provided an introduction to projects and the need to plan a project. Part 2 discussed how to ensure the correct level of detail in a project network. Parts 3 – 9 detailed Steps 1 – 7 of the 10 steps to building an executable project plan. Basis for this post: Advanced Multi-Project Management: Achieving Outstanding Speed and Results with Predictability, by Gerald I. Kendall and Kathleen M Austin, J. Ross Publishing, 2012, Chapter 20.
Step 8: Define time estimates, with range of variability (fourth risk avoidance)
In the new world you are embarking into, do not put a lot of credence on individual task time estimates. The entire solution provides a multi-project environment where work will be completed faster than ever before. Remember that this effort is not mainly about creating good project networks. We are:
- Dramatically cutting project work in progress, thus giving senior management, support groups and resource managers a much faster response time to resource issues and better coaching of resources.
- Eliminating multitasking of project work
- Providing mechanisms such as a fast track issue resolution process, daily task updates and full kits, to remove blocking issues quickly and prevent rework.
- Much more carefully defining the project plan so that work that is needed before a task is started is more likely to be available, with a much clearer definition of the work to be
- Changing to a single priority system, preventing the constant juggling of
You cannot expect people who are providing the time estimates to understand or even believe that all of the above changes will be in place when their tasks execute. Therefore, this process needs to be accomplished in a way that does not confront the people providing the estimates, but at the same time arrives at much more aggressive task estimates than typical of the past.
Approach to Gathering Time Estimates for Each Task
In Step 8, it’s important to have two time estimates for each task: an aggressive, achievable time (if not too much difficulty is encountered accomplishing the task completion criteria) and an understanding of the variability one might experience if there is more difficulty than expected achieving the task completion criteria.
Variability exists in almost every task of a project. We don’t expect the same type of variability in every project or even every task. Some projects have more variability in the beginning, some at the end, others in the middle, and some experience different levels of variability throughout the entire project. Having an understanding of the potential variability in a task gives a context for understanding task updates during execution; i.e., is the task proceeding as expected or are problems occurring which need more time to achieve the task completion criteria? This is crucial information for project and resource managers to know.
In project organizations, the same “types” of tasks are performed repeatedly by similar resource pools. It is tempting to scour the historical records of similar tasks to identify actual task durations and use those (or averages or weighted averages, etc.) for task estimates. We strongly recommend against that practice. Having the historical records are important for evaluating trends to uncover potential improvement areas; however, using those historical records for task times is not a good idea.
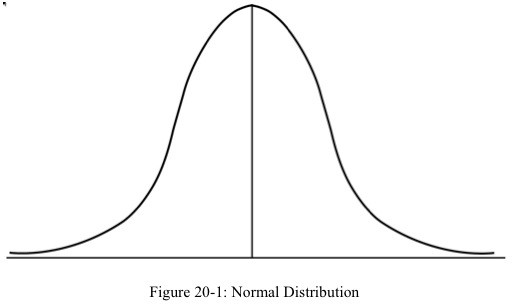
Most people, when asked to describe variability, think about a “normal” (symmetrical) curve, meaning an equal chance of finishing the task below the average (mean) or above the average, with the same level of variation possible in either case. In this type of curve, the mid-point (called the median) of the curve is at the mean, and the most frequently occurring point (called the mode) on the curve is also the mean. Such a curve is most commonly observed in repetitive, controlled environments, such as production, where the same task is repeated many times. See Figure 20-1.
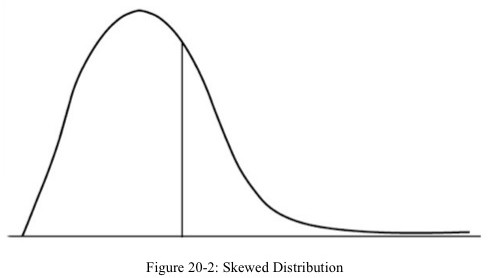
 However, when thinking about variability in project task times, the normal curve does not apply. A project task time typically behaves more like estimating how long it will take to get to work in Los Angeles or worse, Bangalor, India. People who live in big, busy cities may find that, on average, it takes them 45 minutes to get to work. They can recall times when they arrived in just under 30 minutes (minus 15 minutes from the average). But is the worst case plus 15 minutes from the average? No! These people can tell you about the time it took them three hours to travel exactly the same distance.
A project task has a minimum amount of time that it takes to accomplish the steps required to achieve the task completion criteria – that means there is a definite lower limit to the curve, which is greater than zero. Depending on the amount of variability that is estimated to accomplish the task completion criteria – the inherent task variability only – the right tail of the curve can go on for a long time. This results in project tasks with curves that are skewed to the right, with the mean farther to the right than the mode (peak). A significant characteristic of these skewed variabilities is a long right tail. See Figure 20-2.
 What we need for the time estimate is an understanding of both the more ambitious time and the range of variability expected for the task. In gathering the task times from people with experience both in the amount and type of work required to reach the task completion criteria and also the skills of the resource(s) identified, start at the left of the project network for that skill set (ideally, start with a resource skill set that is a path start).
- Work with only the experienced people for that resource skill set or sets and that type of work for a specific section of the project (again we are not looking for a large group tied-up for a significant amount of time; multiple small groups should be used so as to not waste people’s time).
- Ensure you have presented an overview of the project work so they have a
- Present the task description and the resource skills and quantities that are identified for the task.
- Go over all the task notes for the task being estimated to ensure there is an understanding of the work involved and the task completion criteria; if they suggest additions or modifications – especially to the steps or activities to ensure the resources are clear what work to perform, be sure to include them in the task notes.
- Explain that we are looking for the task variability so will be asking for two task
- Ask first for the time that is typically estimated for this task – this is considered the standard or right side of the variability range – remember people are not likely to give a task estimate that they have a high chance to miss.
- Next ask for an ambitious time — how long it would take to accomplish the task completion criteria if no unusual problems occur while accomplishing the task completion criteria. This time gives us the left side of our range for planning and scheduling purposes. We are not looking for the minimum time estimate! This time does have safety and variability in it and is expected to be to the right of the This is a time with less safety in it because fewer problems (variability) are expected.
- The two task times are written as (ambitious, standard) with the time descriptor (d for days or h for hours) For example, if the standard time is 8 days and the ambitious time is 6 days, it would be written as (6d, 8d).
- Repeat for all tasks with the appropriate subject matter
Calendars
When gathering the task time estimates, we are interested in the working calendar only. If the resources work 8 hours a day, 5 days a week, the example (6d, 8d) represents a week and a day for the ambitious time, and a week and 3 days for the standard time.
When multiple resources work on a task and work different calendars, you must accommodate this via resource calendars. This does make it more complex to determine overall estimated task duration times; it is not only the resource(s) that are estimated to need the most time, it is also how the resource(s) spread their task work over their available calendars.
Long Lead (Delay) Variability
When ordering long-lead items, the vendor provides the lead-time estimate. Use that estimate as the ambitious time. Use your experience with the accuracy of the estimate to determine the standard time. For example, if the vendor states a lead time of one month (typically 20 working days) and your experience is that they deliver in that time, use (20d, 20d) as the lead-time task
estimate. However, if they estimate one month, and your experience with them is that they are more likely to deliver within six weeks (30 days), use (20d, 30d) for the lead-time task estimate.
Receiving Task Variability
Receiving tasks have a SNET (start no earlier than) date attribute which represents the date the provider has committed to providing the item to you (at your location). There is a chance they will deliver on time and the ambitious time reflects that – use 0.1 h (typically that is as close to zero time as software will allow ∗). For the standard time, use your experience with the provider. If they are typically two weeks late, the task would be estimated at (0.1h, 10d).
∗ It’s important to understand your software to ensure modeling this correctly!
Iteration Variability
Iteration variability occurs when a series of tasks have to be repeated in order to reach the last task’s completion criteria. This can happen when a test is at the end of group of tasks; if the test is not passed, the work of preceding tasks must be repeated.
Not every project has iteration variability. It must be accommodated and accounted for when it is part of the project environment. Note: Don’t go looking for iteration variability that does not exist. But, ignoring or denying that it exists on paper (when it is in the reality of the projects’ environment) does not cause it to go away!
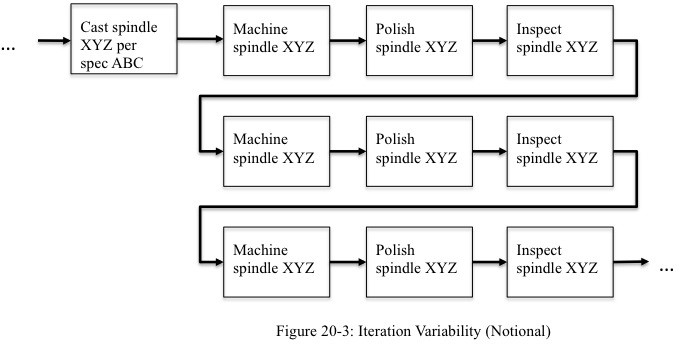
 In Figure 20-3, if the spindle does not pass inspection the first time, the machining, polishing, and inspection must be repeated. There can be variability in the number of times the tasks must be repeated before the task completion criteria are met. Therefore, the process for identifying the quantity of iterations is similar to the process of identifying task times:
- Identify the tasks likely to be iterated (in Figure 20-3, they are the machining, polishing, and inspecting tasks).
- Determine the standard number of iterations (in Figure 20-3 the standard is 3).
- Determine the ambitious number of iterations (in Figure 20-3 the ambitious number of iterations is 1).
- Determine whether the task times for iterations 2 and 3 are the same as for iteration 1 or not. Depending on the work being done, the task times can remain the same, be shorter, or be longer. Ensure you understand and document the estimated task times for EACH iteration in the task notes.
 Figure 20-4 indicates how the network diagram indicates ambitious and standard iterations when the task times are estimated to be identical for each iteration. The tasks put into the network are the ambitious number of iterations. For example, if the ambitious and standard for our example were (2, 3) the tasks would be shown in the network as in Figure 20- 5.
 When task times are different for each iteration, the network diagram would be shown as in Figure 20-3 with the task times indicated per task.
Important note: There is often confusion about what iteration variability means. It is NOT the number of times work must be repeated within a single task to reach the task completion criteria; that would be reflected in the task’s ambitious and standard times. Iteration variability
is specifically when multiple sequential tasks must be repeated in order to achieve the completion criteria of the last task in the series.
Task Time Estimate Final Check
Step 8 is not complete until you’ve reviewed all of the task times. Whenever there is an ambitious estimate of more than two weeks, that task should be broken into multiple tasks. Why? It’s another perspective on risk mitigation, this time in planning for execution. During execution, task updates will be done in the context of remaining duration. It is very difficult to really provide a realistic estimate of remaining duration when a task is planned to be more than 10 days long.
Conclusions
In a lot of the project management literature and in many project management improvement efforts, a great deal of fuss is made over task time estimates. The world would have been much further ahead if the same effort had instead been put into helping people get tasks done more quickly. Estimates are just that – educated guesses, based on past experience, of how long it will take us to do a piece of work several weeks or months in the future. In our opinion, it is a waste of time to focus on accuracy of estimates as a means to improving multi-project results. Instead, in Step 8, we quickly gather two estimates for each task to capture the variability of task time possibilities – one estimate is if things go as normal (a standard estimate) and the other estimate is if almost no problems and delays are encountered (an ambitious estimate).
With this range of variability, we are ready to put these estimates into the plan and see what the total project duration is likely to be.
Next post: Step 9: Seek ways to reduce overall project duration without compromise.


